Cashflow Statement
- Abdulazeez Abdullah

- Jun 27, 2023
- 3 min read

A cash flow statement is a financial statement that provides aggregate data regarding all cash inflows that a company receives from its ongoing operations and external investment sources. It also includes all cash outflows that pay for business activities and investments at a particular time point.
A cash flow statement provides a vivid picture of what happened to a business's cash during a particular period known as the accounting period. It demonstrates an organization's ability to operate in the short and long term based on how much cash is flowing into and out of the business. Cashflow can be prepared monthly, quarterly, yearly, or any period you think will be most helpful.
In this article, I’ll show you how you can create your Cashflow statement with a Jet report.
Step one. Creating a template
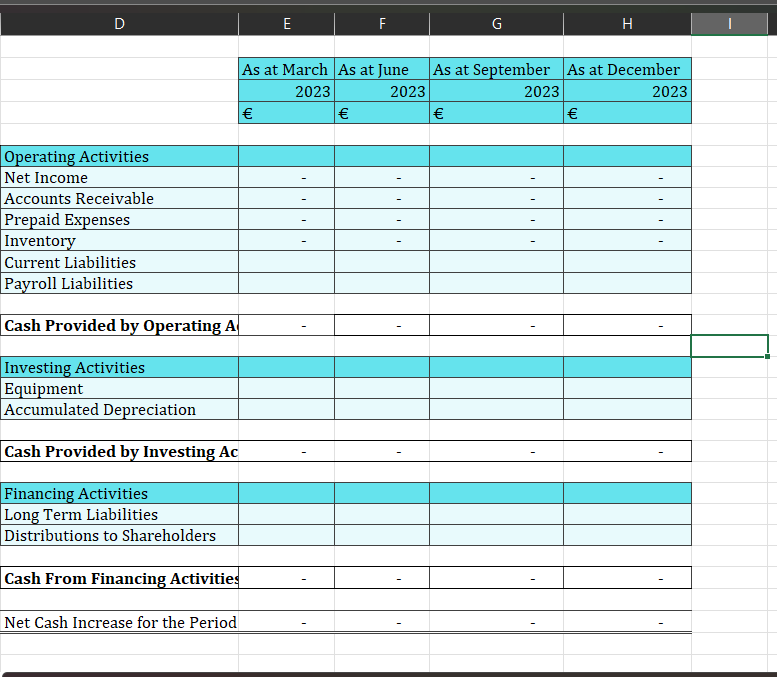
The first thing to do is to create a template of how your cashflow report should look i.e. what are the line items? In this article, the cashflow template will look like the image below;

Step 2 Adding G/L Account Number to your report.
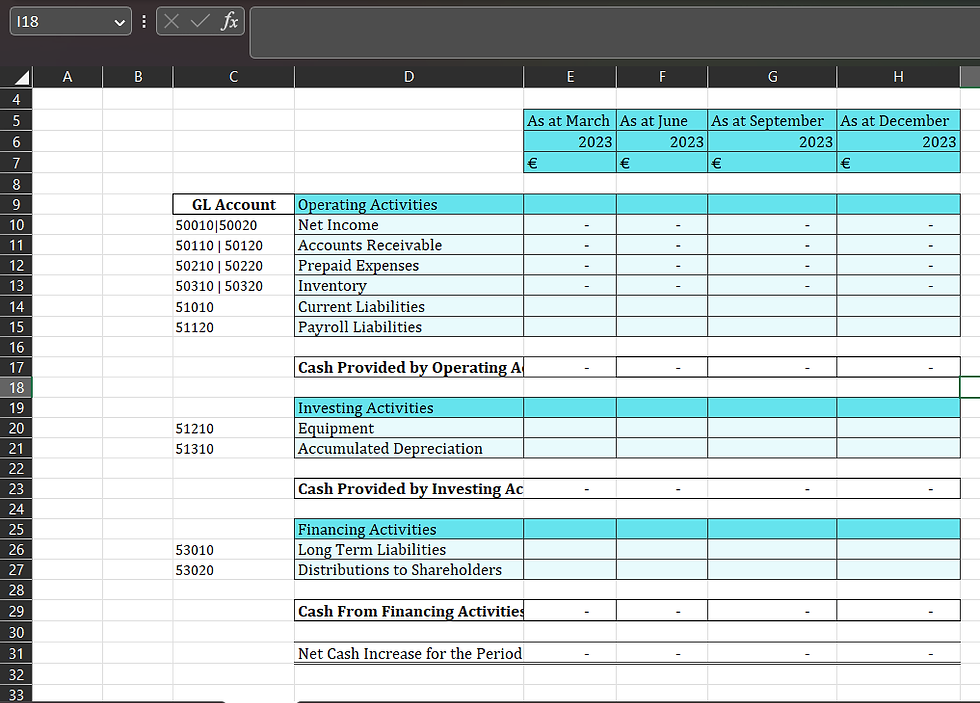
Once your template is ready, the company G/L Account Number needs to be mapped to the template, as shown below.

Step 3 Building our Jet function.
Now that we have our G/L Account no mapped to the report, we can create our Jet function. we do this by clicking on the function we want to use, the GL Function.

When you click on the G/L function, it brings up our function wizard, then we can fill in all that we want.
. We will have different dates in this case since we want our report to display for some specific months.

create a date range for each month
We will create our date range from the report options. so, anytime we want to run for a different year in the same month, we can do that from the report option without changing the report. We start by creating our Report Options page.

Once you fill in the “Start Date and End Date“, click okay. This will automatically create a report options page for you. This is where we fill in all our Date range for the months. as shown below.

I’ll show you how you create for the March quarter, you can just do the same for the rest.
Note: our report contains data for 3 years, 2023, 2022, and 2021. we make our period start and period end to be “2023“, this way it will be easy to get the preceding years from it.
NB: “=“ is the key to creating any formulas in Excel. I did not include “=“ so you can see the formulas, do make sure to include the formulas when creating yours.

Use the formula “Year(C2)“ to refer to the period start.
Use the formula “C13-1”, this tells Excel to subtract 1yr from 2023 which then gives us 2022
Use the Formula “Date(Year, Month, Start Day)” to create the period start and period end for that particular month.
Now let’s fill in our G/L Account formulas.
We fill in as shown below. in this report, we want to show the Balance, with the account number selected. we lock the column of account no by pressing the “fn function key with F4“. we select our start date and end date from the report options and lock down the row. if we want an additional filter, we can add then in the space. when you scroll down, you see a space where we have company. you can select the name of your company there

Step 4 Building the jet function for other cells
we can create the formulas just like we did for the first one, or since we’ve locked the necessary columns and rows, we can easily complete other functions by simply dragging or just filling on at a time.

Step 5 Running your report
I run my report based on Year = 2022.
as shown below, I select my Period to start and End to be in the range of 2022, and when the final result is displayed, we have the title to be… e.g. “As of March 2022“


Comments