Income (P&L) Statement in PowerBI
- Oct 19, 2022
- 4 min read

One of the three statements used in corporate accounting and finance is the income statement. The statement shows the business’s revenue, gross profit, selling and administrative costs, other expenses and income, taxes paid, and net gain over a certain period.
If I were an accountant, I wouldn’t want to create an income statement every month, quarter or year.
How, then, can I make my life and work easy?

Photo by Diana Parkhouse on Unsplash
PowerBI is the solution. Create a report once and let it auto-refresh as you have more data

Photo by krakenimages on Unsplash
Download sample data here
The following tables are needed for the income statement report and loaded into PowerBI.

The Company expenses data looks somewhat like this, which is unsuitable for our data model. Hence the need to unpivot.

After unpivoting, the data is now suitable for the data model.

The final model looks like this.

The format I usually stick to is dimension tables at the top with fact tables underneath it, while supporting tables are at the bottom. DAX measures tables are always by the right. That way, I have a clear overview of all tables in my model.
An income statement speaks to the organization’s revenue and expenses. The tricky part is merging the sales data and company expenses data. Put in mind that both data have different granularity, i.e. the sales data is on a day-to-day basis while the expense data is monthly.
How, then, do we ensure they have the same granularity?

Photo by Kenny Eliason on Unsplash
Create a supporting table from the Sales data

Photo by Ameen Fahmy on Unsplash
To do this, let’s first calculate our total revenue using the Sales table.

Next, we create a supporting table from the sales table whose granularity is a monthly interval. To do this, we use the DAX seen below to create a new table.

The SUMMARIZE function is similar to SQL Group BY. It groups the specified table based on the columns in that table or related tables. In our case, we are grouping the sales table by the sales channel and the Month & Year columns on the calendar table.
Now we have a sales table with the same granularity as the company expense table.

Then we combine both the Sales data and the company expenses data into what will be our income statement data using the UNION function.

The Union function returns a table that contains all rows from both tables. The caveat with this function includes;
The two tables must have the same number of columns
Columns are combined by position in their respective tables, irrespective of the column content. Hence the need for another summarize function to ensure the data merge appropriately.
The column names in the return table will match the names in the first specified table, i.e. the Company Expenses column names will be inherited.
The result is seen below.

The type and type index columns were added using an if statement.


The reason why I added these columns would be seen later on.
If we look at the income statement template, we have the following items;
Total Revenue
Total COGS
Total Gross Profit
Gross Profit %
Total Other Expenses
Total Net Profit
Net Profit %
Since they are not included in our data, we would have to write dax measures to calculate them individually.

Calculate Total Revenue

2. Calculate Total COGS

In accounting, expenses are recorded with negative values, hence a need to multiply the calculated function output by -1.
3. Calculate the Total Gross Profit

4. Gross Profit %

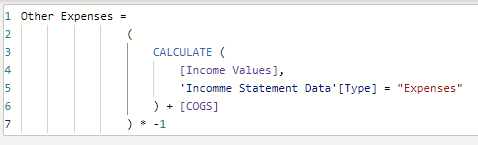
5. Total Other Expenses
6. Total Net Profit

The addition is done here because the COGS and Other Expenses will have negative values.
7. Net Profit %

Now we have created all the individual totals. We need to reference all these measures in a single DAX.
We are almost there

Photo by Jonathan Chng on Unsplash
All that is left is to calculate the actual values. The DAX below will help us achieve this.

This will return the row item values on the income statement template.

The recipe to prepare our income statement is fully ready.

Photo by Eden Constantino on Unsplash
Let’s create our income statement
You know the sweet thing with PowerBI

Photo by Blake Cheek on Unsplash
You can run comparisons. This year vs last year, Q2 vs Q1.
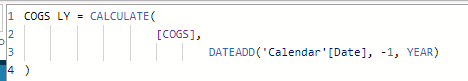
Let’s take a quick look at the DAX that lets us achieve this year vs last year.
Total Revenue LY

2. Total COGS LY
3. Total Gross Profit LY

4. Gross Profit % LY

5. Total Other Expenses LY

6. Total Net Profit LY

7. Net Profit % LY

8. Actuals LY

What is the difference between this year’s and last year’s performance?

I know what you are thinking, so why not use this?

Sadly you will get the error below.

This is a result of the format function used in our DAX measure.
What is the percentage of this difference?

All that is left is just for you to add these new measures to your table, and you are done.

View the completed report here.
Next year, next quarter, or next month, you don’t have to spend minutes or hours creating an income statement. All you need to do is ensure the data source is updated. Your finance manager does not need to wait days to get the report, and the award is yours.
Congratulations on winning the employee of the month/year award.


Comments