Unlocking the Mystery of Customer Behavior: Understanding Days Since Last Transaction
- Abdulazeez Abdullah

- Feb 13, 2023
- 2 min read

Business Problem — Identify how long ago customers purchased a product.
Why is this a business problem?

A paying customer is a happy customer meaning customer retention is as integral to revenue as new customer acquisition, which then leads us to understand customer behaviour.
One way to understand customer behaviour is to identify the last time a customer did a transaction. You can then create strategies around this, offer them discounts to bring them in, get their opinion on the product and see if there is anywhere, we can improve, etc.
The DAX measure that lets us calculate this is seen below. Personally, if I’m not going to be reusing a measure, I create it as a variable.

Let’s break the DAX into pieces.

Recall that we are trying to identify how long ago a particular customer did a transaction. To get this, we need the last date the customer made a trade and then compared that date with a base date. Usually, the base date should be today’s date, and as the day progresses, the base date changes. In Excel and PowerBI, we have the TODAY() function to get this.
But because this data is hypothetical, we won’t be using the TODAY() function because of the data used. The data ended in 2019, so comparing those transactions in 2019 with today seems far-fetched.
Hence the base date will be the last date any transaction was done in the data. Line 3–7 calculates this for us.

We are telling PowerBi to remove all context on the Sales Data table and give me the last date on the sales data table, i.e. ignore the relationships all relationships on the Sales Data table.
Line 9–10 gets the last date each customer made a purchase.

As we can see, each customer’s last purchase was made on a different day.

All that is left is to get the difference between these two dates.

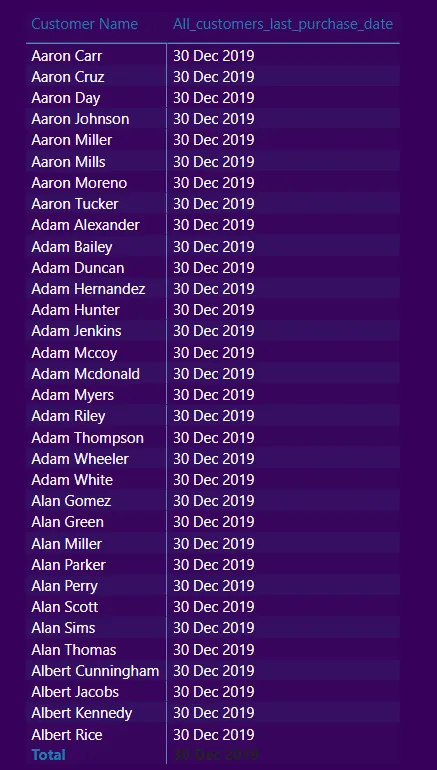
The result is seen below. Our base date is the 30th of December 2019 because that was the last time any customer made a transaction.

In a real scenario, the DAX will look like this.

The result will then look like this.

You can see the difference when using the TODAY() function. The number looks outrageous because the last sale was made in 2019 and today is 2022.
Continue playing with DAX measures to bring out those great analytics.


Comments